Excel Dashboards
Project Objective
December 2023
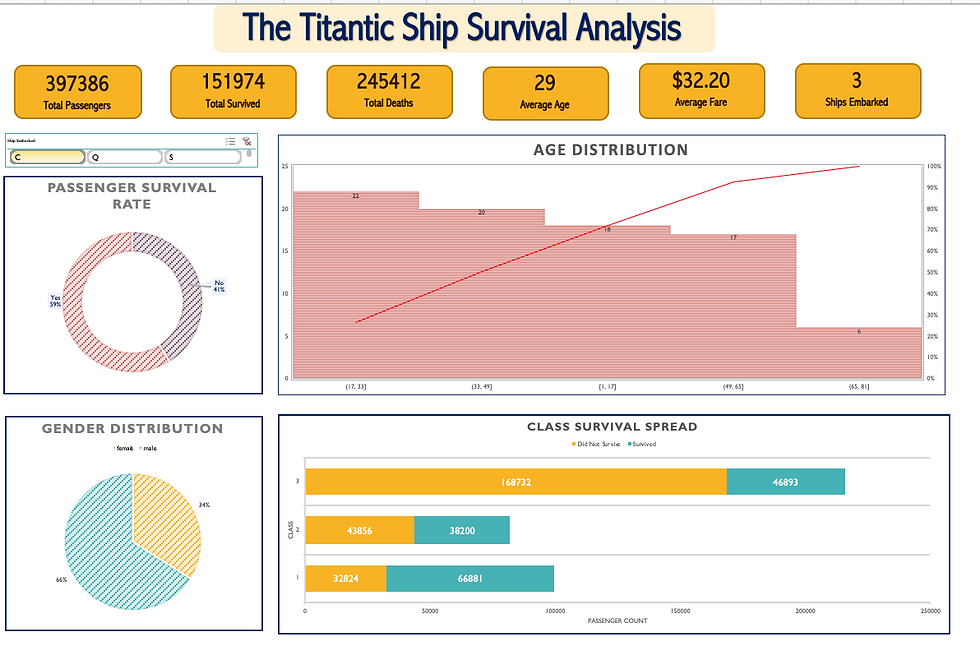
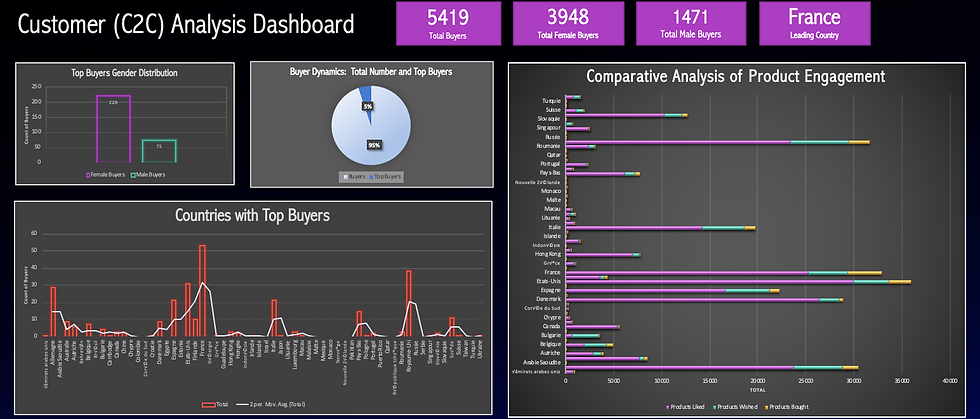
I applied advanced functions and formulas in Excel to meticulously ensure the accuracy and integrity of the data. The focal point of these projects was the creation of Excel dashboards, wherein I demonstrated proficiency in analyzing market, sales, and survivorship performances.
My expertise extended to applying complex functions such as VLOOKUP, INDEX, and Pivot Tables within Excel, enabling the display of intricate trends identified within the dataset. To enhance the user experience and facilitate in-depth exploration, I designed visualizations with, strategic filters and parameter controls, providing a comprehensive and interactive perspective on the analyzed data
Business Opportunities:
-
Customer Segmentation: Utilize customer purchasing behavior analysis to create targeted marketing campaigns, personalized promotions, and improved customer experiences, leading to increased customer retention and loyalty.
-
Sales Performance Optimization: Identify high-performing products, sales channels, and geographic regions to allocate resources effectively and focus on areas with the highest revenue potential.
-
Price Optimization: Analyze historical pricing data to determine optimal price points for products. Implement dynamic pricing strategies to maximize revenue while remaining competitive in the market.
-
Churn Analysis: Implement predictive analytics to identify potential churn indicators among existing customers. Develop retention strategies to reduce customer attrition and increase overall customer lifetime value.
Key Skills:
-
Data Entry and Formatting
-
Formulas and Functions (e.g., SUM, IF, VLOOKUP)
-
Data Analysis (Sorting, filtering, and basic analysis)
-
Charts and Graphs
-
PivotTables
-
Data Validation
-
Conditional Formatting
-
Trend Identification within Datasets
-
Designing Visualizations
-
Strategic Filters and Parameters Implementation
-
Data Science for Exploratory Data Analysis